Author

Arjan Neef
Testing, research and development
Combining datastructures
Storing data doesn't mean it can be found. Finding data doesn't mean it's of any use and using data doesn't necessarily mean it's meaningful. But how do you find data, how can you compare data and what gives it any value? If you're not careful, your data becomes a mess and will only slow you down. Perhaps it's even better to start all over again? You probably get my point by now.
Handling and storing data is a difficult process. Not only do you need to think about technical limitations and requirements you also need to make sure people understand why this is done. You can organize all your data but if nobody understands the principles behind it the data becomes complex, corrupt or useless. Understanding this requires abstract thinking not everybody is able to do easily. It probably sounds boring too. And that is a problem you cannot ignore if you want your share data and turn it into valuable information. You need other people to understand data if you want them to benefit. So you better make sure it's easy to understand and accessible without a fuzz.
Principles
One of the most important obstacles for data to be of any use are humans. If you try to explain the importance of data half of the audience probably falls asleep or walks away. Browsing through data feels like diving into a never ending maze with lots and lots of details that are too hard to overcome. Perhaps you are thinking that AI will do this for you, but AI cannot find correlations in unstructured data and if it does it's probably biased and hard to understand. To do this right, you have to start normalizing your data. Normalized data can be compared with other data. This is were the solution starts.
To overcome the complexity of data I came up with an approach to keep data understandable, usable and comparable. If you understand these principles, you can keep adding data and continue to grow. The data can be processed by humans or AI just as long the data is properly organized and structured. To achieve this I came up with some guidelines when dealing with data:
- Divide your data into logical groups based on function or purpose of the data;
- Setup a model that can store multiple data tree structures. Each structure represents a logical group;
- Data can not be part of more than one logical group. If it doesn't fit, look at your groups;
- Actual data can only be added at the end of a tree. Everything else is only to categorize data in the tree itself;
- Make sure a tree is flexible so that branches can be reshuffled if new data won't fit otherwise;
- Normalize new entries and generalize data if similarities occur;
- Try to limit the number of splits of a branch;
- Only connect other trees at the bottom of each other.
Are you still with me? It probably sounds too technical to understand immediately but that's ok. I'll try to explain them one at a time. But first have a look at a working example based on the human body and its functions.
Anatomy of a human
To test my methodology I decided to take a data driven approach while examining the human body. I want to link what we eat to how this can affect the complains we experience when something of our body fails. You cannot directly link eating (or not eating) fruit to a headache but perhaps by linking the right data you can see that there is (or isn't) a relation between fruit and a headache. To do this I came up with a few different logical groups that contain all relevant information to find these relationships. The different tree groups look like this:
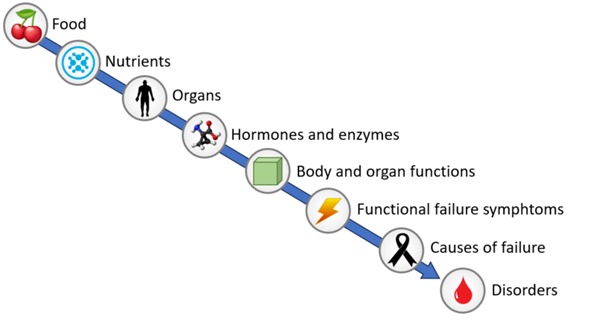
As you can see, there are 8 different (logical) groups the data needs to be stored in. To keep these groups organised for each group a tree structure has been created. This is especially helpful to determine how much detail information should be added before the information is usable enough for the task ahead. The purpose of these tree structures is to eventually link the edges of the tree together. How the tree structure for each group is setup is done in such a way that everyone can easily navigate down the tree and find what he or she is looking for. If you think this is very complex, you're right. But if you continue reading you'll notice that it all seems very straight forward and makes sense. (I hope). Properly organising and structuring data makes it easy to work with.
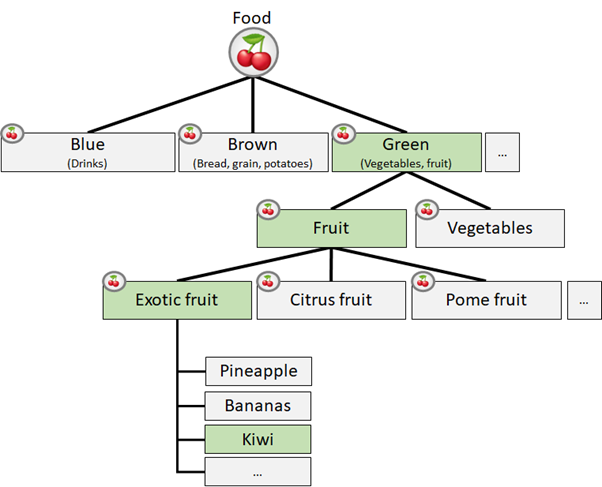
As you can see, it only takes 4 steps to find a kiwi. So this tree isn't very deep. You can also divide kiwi to various different types of kiwi but you have to ask yourself how this affects the ultimate goal. At this point I decided not to go down any further as this level of detail should be enough.
Below the food tree is the nutrients tree. Again, Ive setup a tree to distinguish all different types of nutrients to a level of detail I think should be enough. When you've fully created a tree its time to link the trees together. When you link these trees it looks a little like this:
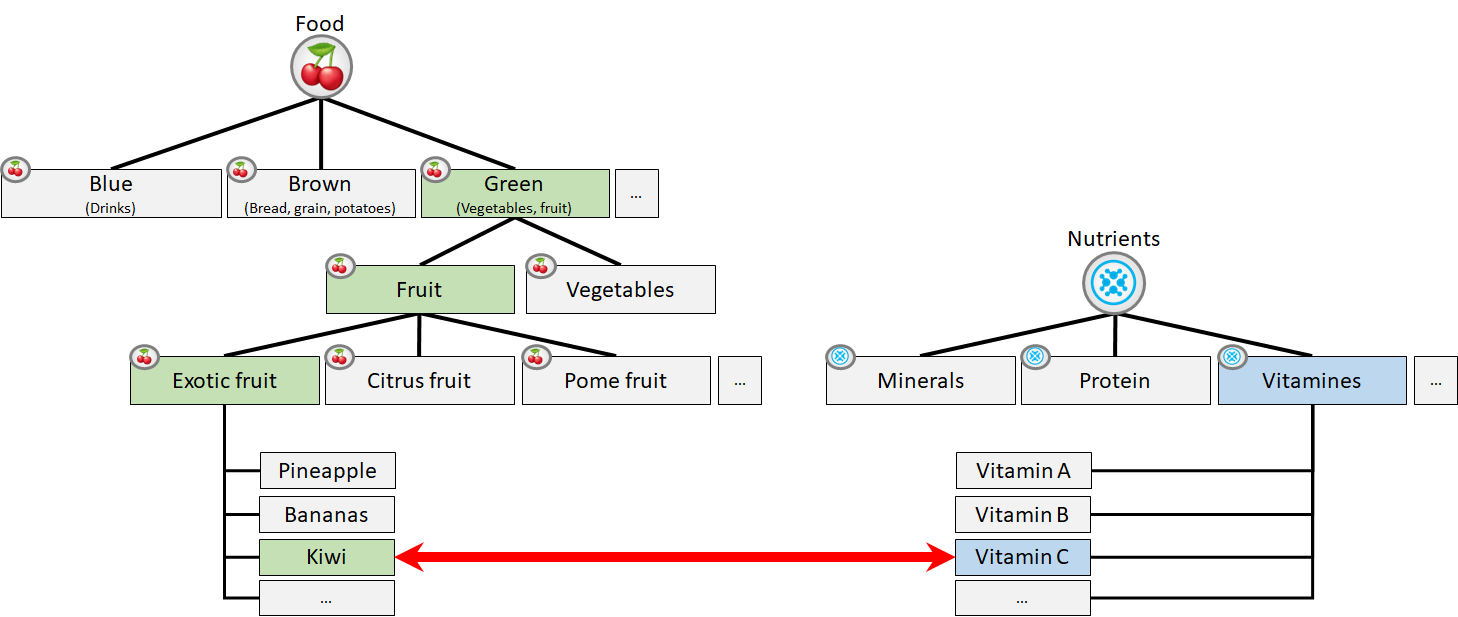
As you can see, a kiwi contains vitamin C but no vitamin A. You can also see that a kiwi is an exotic fruit and vitamin C is no protein. If you continue to create these trees you'll eventually end up having a dataset that will tell you eating a kiwi will help you see better in the dark. A kiwi a day will keep the optometrist or eye doctor away! This can be seen in the full tree structure as vitamin C is linked to the ileum which makes retinol which is good by your eyesight and keeps the skin young. If you reverse this process based on this dataset a doctor could ask you if you eat enough fruit when you're complaining about being unable to see properly in the dark. The data will support this and perhaps create links that would otherwise never get noticed. If you would like to see this, the model is setup in Dutch so just get in touch with me and I'll show you.
Back to the data structure, if you're able to store your data using this methodology you'll be amazed how your data will actually be useful and easy to understand. Now let's go through the basic guidelines for this I mentioned earlier.
Divide data in groups
Keeping data in a group allows you to organize the tree structure within this group without worrying about the other data groups. Especially since data structures should only be linked at the bottom of a tree. It doesn't matter how the tree itself is organized because in the end, the real information in a tree is located at the bottom. Setting up a structure like this actually helps you to organize the tree itself. When you want to add new data and it doesn't really fit in the current structure youre forced to change the structure of the tree itself. This gives you insights on the data you otherwise wouldn't see.
Multiple tree structures
If you setup a data model, make sure it can distinguish data by tree. By doing so you can add verification algorithms to see if you link or add data breaking the guidelines of your model. These algorithms will help you keep the structure tidy and neat. It won't allow you to break the guidelines so you cannot make a mess of your data. These algorithms can be complex to setup but once they are in place it helps you to obey the guidelines and keep your data organized and usable.
Avoid duplicate data
In a relational database it's very easy to link data. By making data part of multiple trees you'll make a mess, there is no doubt about that. This is because you'll break the option to reorganise a tree structure without worrying about the other tree. Especially if you cannot see if the data is part of more than one tree. If you really need to break this rule you have to ask yourself if there is no other way. Keep it simple.
Flexible tree
When you're creating your tree structures you'll probably be shuffling and shifting data around until you're satisfied with the result. If this shuffling, renaming and shifting isn't supported by the tool youre using it makes it very hard to do so. In the beginning you'll be changing the structure a lot. Your tool should support this otherwise it will be a frustration process and probably your users will run away mad.
Normalise data
It's very important to normalize your data. By normalization I mean to group or merge similar data together, make sure numbers are using the same unity and try to keep the depth of the tree at all branches the same. If for example you want to add "green grass" and "yellow grass" in your tree but the color has no significant meaning then don't add them but only add one entry named: "grass".
Connecting trees
Last but not least, the real value of multiple trees is where you combine them together. This is where you actually add value to the datasets. It is however important to realise that trees should never be connected other than on the bottom of a tree. That is because all levels above the lowest entry on a tree are only used to categorize the elements in the tree. The lowest entries of a tree are called leaves, and they are the carriers of the real information. If you connect branches between different trees not only do you mess up the entire structure youre entangling information that is very hard to untangle. Just don't do this. My tool will never allow you to do this and make sure your tool doesn't allow this either.
If you would like me to help you organize your data or provide tooling don't hesitate to contact me. I'm happy to help.